Technical Annex A: Jobs and the informal sector – the mechanisms underlying the scenario estimates
By Brian Levy and Alan Hirsch
Technical Annex A: Jobs and the informal sector – the mechanisms underlying the scenario estimates
This technical annex lays out the quantitative assumptions that underlie the scenarios presented in Table 1 in the Jobs and the Informal Sector blog; while they are intended to be broadly plausible, we make no claim that they are empirically precise. Rather the aim is to underpin a series of heuristic thought experiments, the intent is to clarify the mechanisms at work, and the resulting orders of magnitude of changes in employment over 10 years for each of formal and informal firms for each of a variety of scenarios. The scenarios vary across two dimensions:
1. The rate of formal sector growth: 4% in some scenarios, and 0% in others; and
2. Whether the business environment for the informal economy is restrictive or supportive.
Four sets of assumptions underpin the scenarios:
1. Assumptions as to the initial (time zero) point of departure for output and employment;
2. Assumptions as to the employment elasticity of growth within the formal economy – and the extent to which this growth ripples into the informal sector within a still-restrictive economic environment for the informal sector;
3. Assumptions as to the relative productivities of formal and informal firms; and
4. Assumptions as to the growth trajectories of informal firms in response to liberalisation – both the rates of growth, and the extent to which they occur through the displacement of formal firms and how they vary according to whether the formal sector growth rate is 0% or 4%.
Each is discussed in turn below.
First, Table A1 below summarises the ‘time zero’ points of departure for output and employment. These are intended to be broadly aligned with South Africa’s early 2020s empirical realities. (If the total labour force is assumed to be 26 million; time zero unemployment thus amounts to roughly 10 million.)
Table A1: Points of departure

Second, in calculating the employment scenarios in Table 1, formal-sector employment growth is derived from output growth using an assumed formal sector employment elasticity of 0.7. This employment elasticity is at the high end of estimates for the South African economy – and for middle-income countries more broadly. (As our earlier blog posts detailed, even with this expansive assumption accelerated formal sector growth alone emerges as insufficient to resolve South Africa’s unemployment crisis.) In the absence of any liberalisation of its enabling environment, the informal economy’s employment elasticity in response to formal sector growth is assumed to be 0.5 that is, in a still-restrictive environment 4% annual growth for the formal sector translates, via income and demand effects, into 2% annual growth of employment within the informal sector.
Third, labour productivity is normalised against a baseline value of 1.0 for formal firms. Along with survivalist informal firms, we also characterise relative labour productivity for a third (middle) group the connective middle. We assume a labour productivity ratio of 3:2:1 for the three groups. Setting labour productivity for formal firms at 1 thus yields 0.67 for the middle group and 0.33 for survivalist firms. (Note: the 3:2: 1 ratio is a convenient simplification. While, say, a 5:2:1 ratio may be closer to the empirical reality, given the focus of this blog and the next on the impacts of change on employment – for which the largest impacts come from the creation of new informal sector jobs, with only a very marginal impact as a result of cannibalization of formal sector jobs – the empirical downside of the simplification is small.)
The fourth set of assumptions addresses how informal firms respond to reforms that improve their economic environment. (For now, the discussion assumes that the connective revolution has not yet occurred.) Even with a stagnant formal economy, the reforms open up three potential avenues for increased economic activity:
- A new market/quality effect: enhanced opportunities and improved capabilities enable informal firms to offer better products and services, attracting additional demand – both within the township economy and from firms and households in the formal, higher-income economy. (Note that the latter can, to some extent, occur via the ‘cannibalisation’ of markets that hitherto had been served by formal firms.)
- A price effect: lower costs reduce prices, encouraging township households and firms to purchase more.
- An income effect: higher productivity and lower prices raise real incomes, particularly among lower income households, generating additional spending within the township.
Table A2: How informal firms respond to an improved economic environment
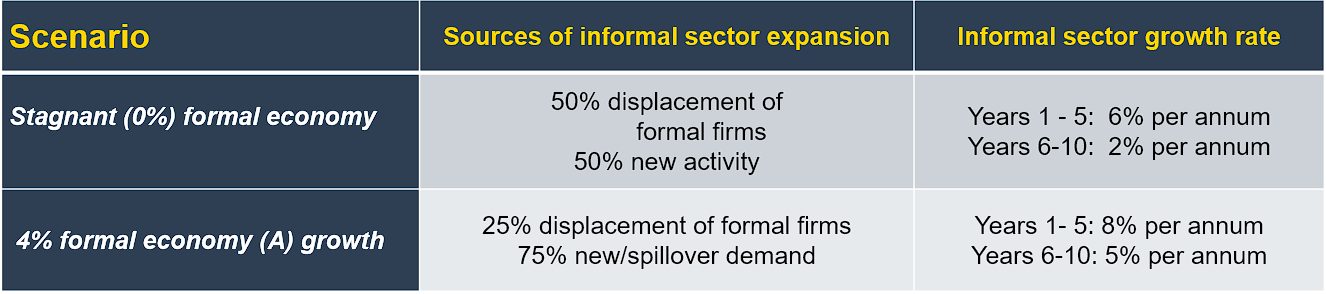
To begin with the top-left cell: In this stagnant scenario, about half of the informal sector expansion is assumed to come from displacement of formal firms – a consequence of improved access of informal firms to markets outside of the ‘township’ economy. As noted in the main text, the result is likely to be opposition by incumbent firms to the opening up informal firms’ access to higher income markets in the formal economy.
By contrast, as per the bottom left cell, in a growing economy, new opportunities play a greater role, with (hopefully) less pushback against reforms that liberalise the informal sector.
As the right-hand column of Table A2 shows, along with these differences in avenues of expansion, are differences in rates of expansion. As per the top right cell, in an otherwise stagnant economy, reforms to improve the economic environment for informal enterprises are hypothesised to translate into an initial growth spurt, but one that subsequently loses steam. By contrast, in an expanding formal economy the initial growth spurt is presumed to be rapid (though, by assumption, constrained somewhat by capability
constraints) and continues, at a slower rate, throughout the decade, yielding (as per scenario 3 in Table 1 of the main text) a cumulative 3.5 million informal sector jobs over the course of the decade:
Throughout, to avoid overhyping or otherwise biasing the results, the assumptions made vis-à-vis the magnitudes of the various parameters are intentionally cautious:
— The informal economy’s employment elasticity of 0.5 in response to formal sector growth is within the range of empirical estimates of the overall elasticity of employment of output for the South African economy as a whole. (To underscore: it is specifically in scenario #2 – accelerated growth in a still restrictive economic environment for informal firms that this elasticity is the principal driver of increases in informal sector employment.)
— Given the vastly larger size of South Africa’s higher-income formal markets relative to the township economy, even in a stagnant overall economy, the assumption that the direct effects (opening up access to a massive new market) and indirect effects (an infusion of income into the township economy) of liberalisation of the economic environment for the informal sector together result in 6% average annual growth – and only for an initial five years (and subsequently assumed to decline to a paltry 2%_ – seems conservative.
— The additional 2% growth rate in the initial five years in the 4% growth + liberalisation scenario follows directly from combining the above two sets of parameters – as does the modest 3% added for the subsequent five-year period.
As a concluding comment, it may be worth underscoring that there is no intent to argue that the selected
magnitudes are the ‘right’ ones. Readers are encouraged to consider the employment impact of other assumptions– with the framework and magnitudes laid out above hopefully providing some rough guideposts as to the mechanisms involved, and how they might play out in the real world of the contemporary South African economy.